
climate data
From Climate Data to Design Impact
C4B is a web platform for site-specific climate and energy analysis.
It provides instant, data-driven climate and energy insights before design begins, guiding better decisions for architects, engineers and developers.
Start your 7-day free trial
Try the full Essential plan for 7 days: save projects, get design direction based on your location and explore future climate scenarios. No credit card required.

climate data

Typical Hourly Outdoor Temperature, Humidity, And Adaptive Comfort Conditions
energy data

PV Energy: Aggregate Yearly Potential
climate data

Sun Path Diagrams
climate data

Daily Wind Rose Diagram
energy data

Geothermal Potential
climate data

Climate Zone
energy data

Country Grid Carbon Intensity Assessment
design direction

Comfort Strategies for Outdoor Environments
New York, USA: Shade is the most effective lever for outdoor comfort here. Compared with a fully exposed spot, shade alone adds 4 percentage points of comfortable time, while wind shelter alone adds 8 points. Together, shade and wind shelter raise comfort to 52% of hours. Provide layered, adjustable protection so spaces can be tuned to season and time of day.
climate data

Annual Wind Rose Diagram
energy data

Solar Radiation
climate data

Precipitation Event Intensity
design direction

Optimal PV Panel Orientation
climate data

Monthly Daytime Cloud Coverage Overview
climate data
Precipitation Overview
climate data

Outdoor Comfort - UTCI
climate data
Location Information and Data Summary
climate data
Typical Hourly Outdoor Temperature, Humidity, And Adaptive Comfort Conditions
energy data
PV Energy: Aggregate Yearly Potential
climate data
Sun Path Diagrams
climate data
Daily Wind Rose Diagram
energy data
Geothermal Potential
climate data
Climate Zone
energy data
Country Grid Carbon Intensity Assessment
design direction
Comfort Strategies for Outdoor Environments
climate data
Annual Wind Rose Diagram
energy data
Solar Radiation
climate data
Precipitation Event Intensity
design direction
Optimal PV Panel Orientation
climate data
Monthly Daytime Cloud Coverage Overview
climate data
Precipitation Overview
climate data
Outdoor Comfort - UTCI
what C4B does
Read the location. Build the data. Design with it.
Three capabilities, running on one location.
data analysis
Compile data
Historic climate data for variables including temperature, humidity, cloud cover, precipitation- pulled from the most granular climate databases we can find.
data manipulation
Assess and develop graphics
Weather files compiled to your own specification and morphed forward to future climate. Graphics ready for presentation to clients- instantly.
design direction
Preliminary design direction
Massing and orientation advice, passive design strategies, outdoor comfort interventions, and the reasoning behind each one- written for your project and ready to defend.
energy data
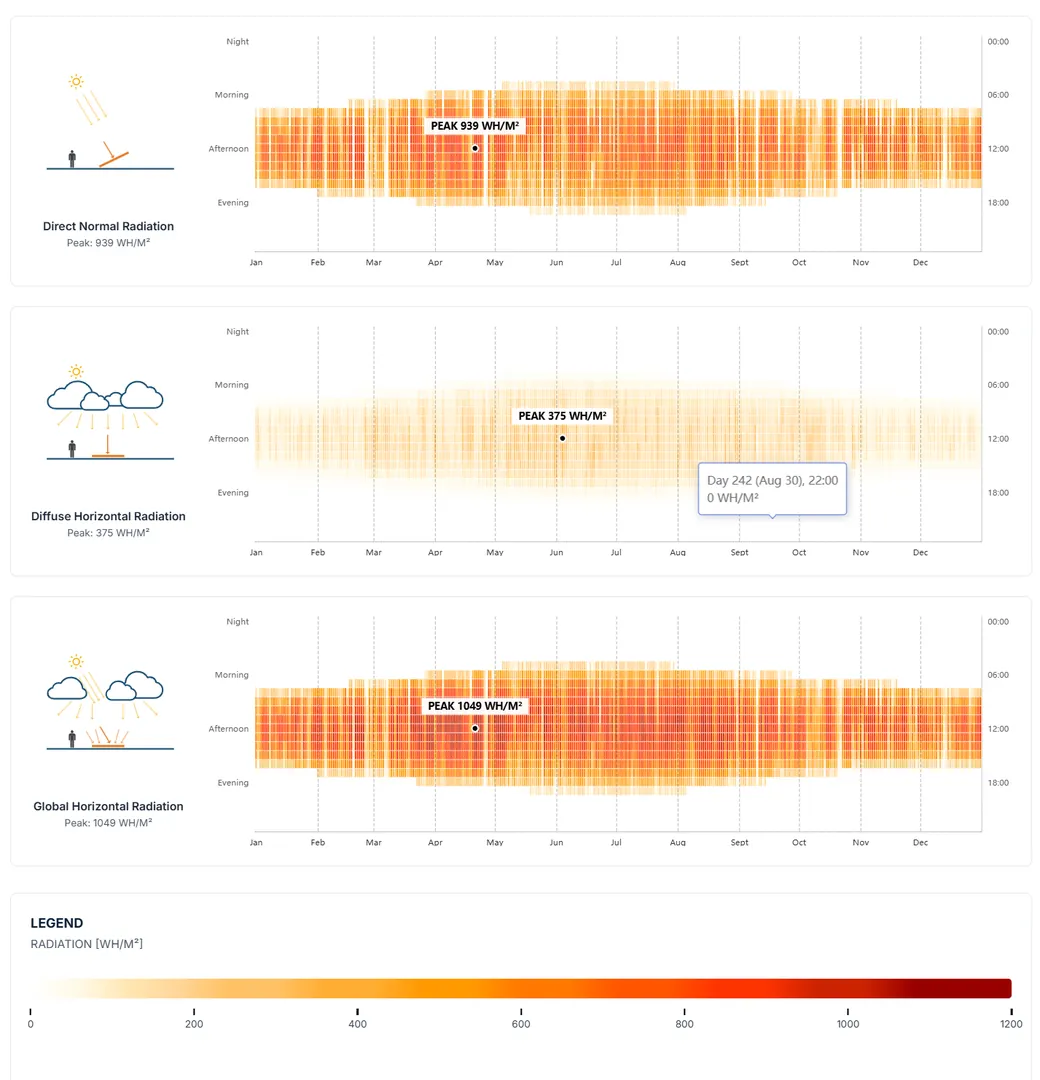
Solar Radiation
Displays the solar energy reaching the site across its three components (direct normal, diffuse horizontal, and global horizontal), interpreted for photovoltaic generation potential.
design direction
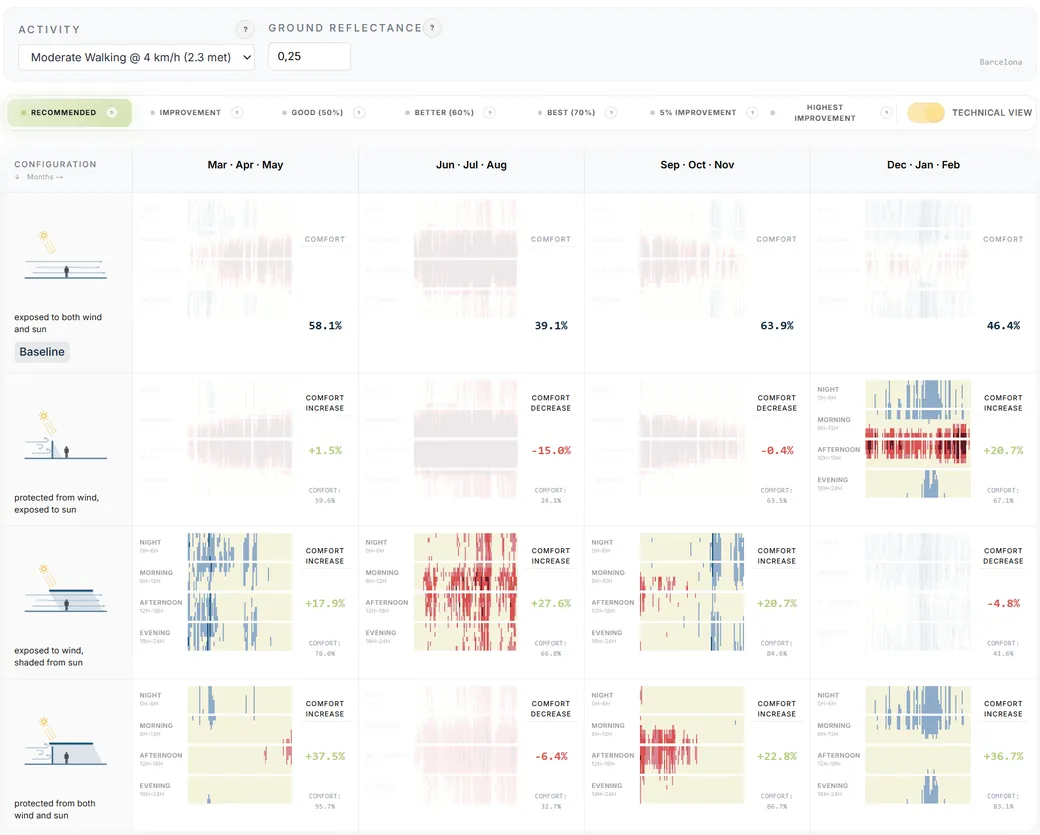
Comfort Strategies for Outdoor Environments
It tests how design interventions affect outdoor thermal comfort using the UTCI index. It's a matrix of strategies (exposing or protecting a space from wind and/or sun) across the four seasons, where each cell shows an hourly heatmap from cold stress to comfortable to heat stress, plus a comfort percentage, revealing which mix of shading and wind protection best improves year-round comfort.
climate data
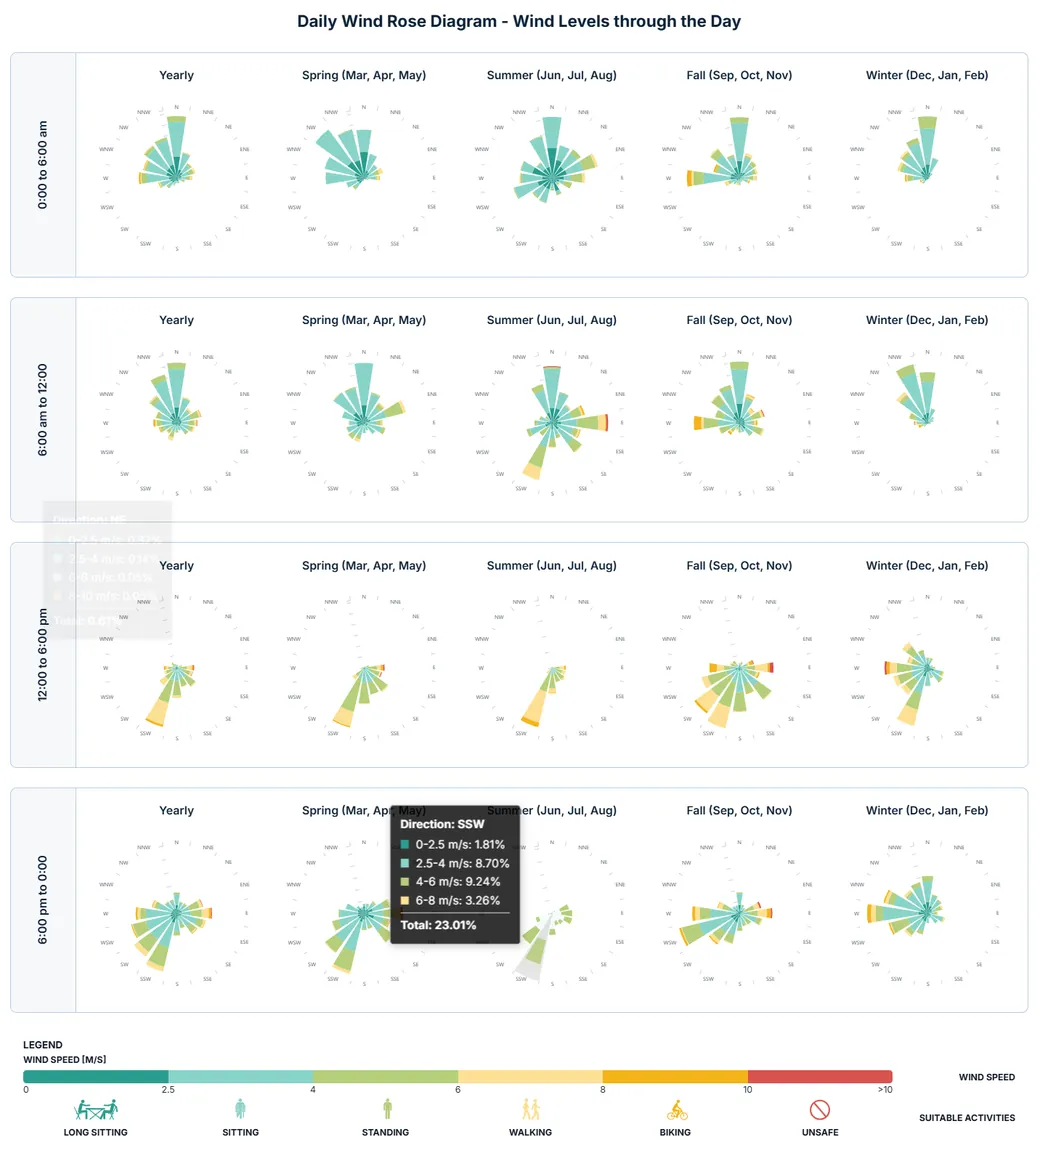
Daily Wind Rose Diagram
Wind analysis broken into four times of day by season, showing how wind shifts through a typical day.
platform
Everything your site tells you, in one place.
Every project runs the same four categories of analysis, for any coordinates in the world. Each output is turned into graphic, explained, and ready to use.

Climate Data

Energy Data
Design Direction
Technical Design
Product demo · 3:08
Four places where C4B goes further.
Finding weather data is sometimes the easy part. These four capabilities change what you can actually do with it.
01

Weather station vs. site-specific data
Use the nearest station, or a dataset interpolated to your exact coordinates. Switch between the two and see the difference.
02

Future Climate Scenarios
Run the same site under future climate projections and see what design advice still holds.
03

Custom EPW Generator
Manipulate and download a weather file, ready to drop straight into your simulation workflow. Typical years, extreme years, hot years- you choose the parameters.
04
Intelligence
Every module comes with a written insight of what it means for your site. Mostly automated, selectively AI-assisted.
01 | site specific data
Your actual site, not the nearest weather station.
Many readily available weather files are tied to the closest weather station, which can be kilometers away from your site, at a different elevation, in a different microclimate. In some contexts this gap is fine, but in others the difference in weather data is substantial.
C4B builds a dataset interpolated to your project’s exact coordinates, so the climate you design against represents the site itself, not a proxy some distance away.
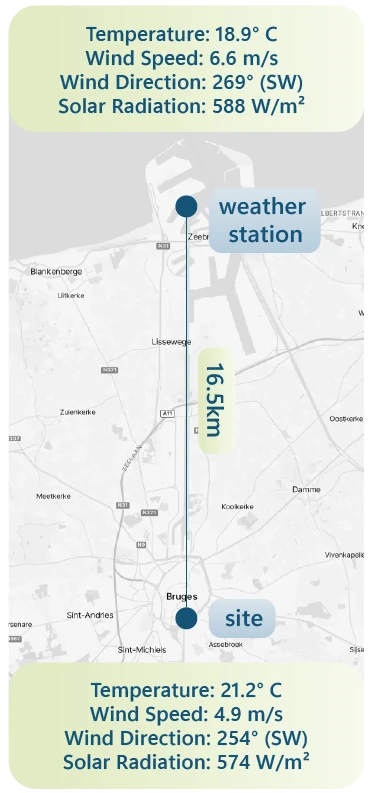
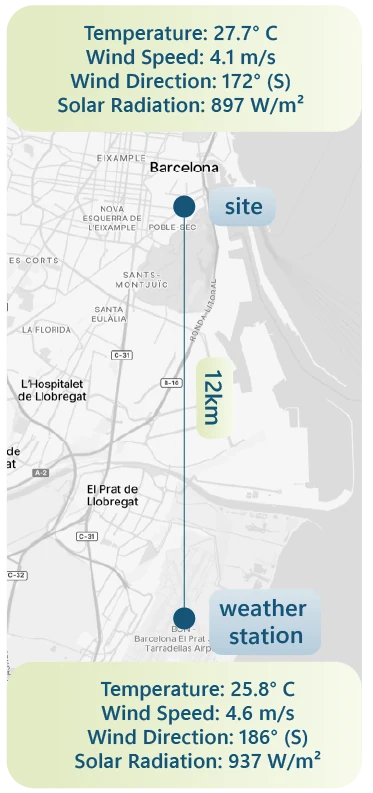
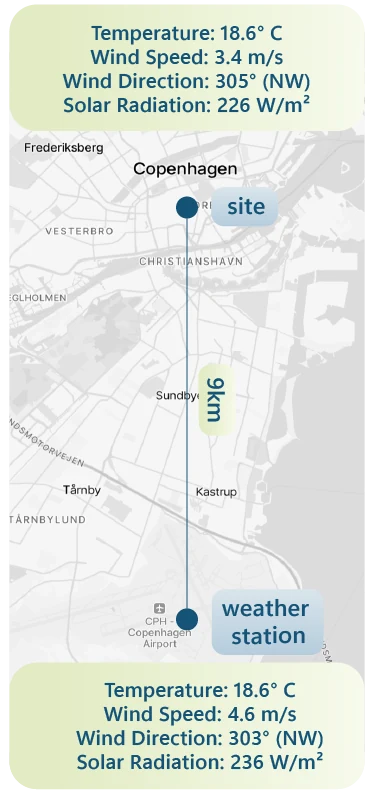
Bruges, Belgium · Data from 12:00PM on June 21st, 2020
02 | future climate scenarios
Test the design against the climate it will actually live in.
Five IPCC Emissions Scenarios
Very Low SSP1-1.9 | ~1.5 °C by 2100 |
|---|---|
Low SSP1-2.6 | ~1.8 °C by 2100 |
Intermediate SSP2-4.5 | current trajectory · ~2.7 °C |
High SSP3-7.0 | ~3.6 °C by 2100 |
Very High SSP5-8.5 | ~4.4 °C by 2100 |
A building drawn today will stand through decades of a changing climate. Historical weather data tells you where the site has been, not where it will be.
Set the completion year and the building lifespan. C4B morphs the site’s weather file to the building’s mid-life year and generates one EPW per emissions scenario, ready to run in any module or download for your own tools.
03 | custom EPW builder
Customize your weather file.
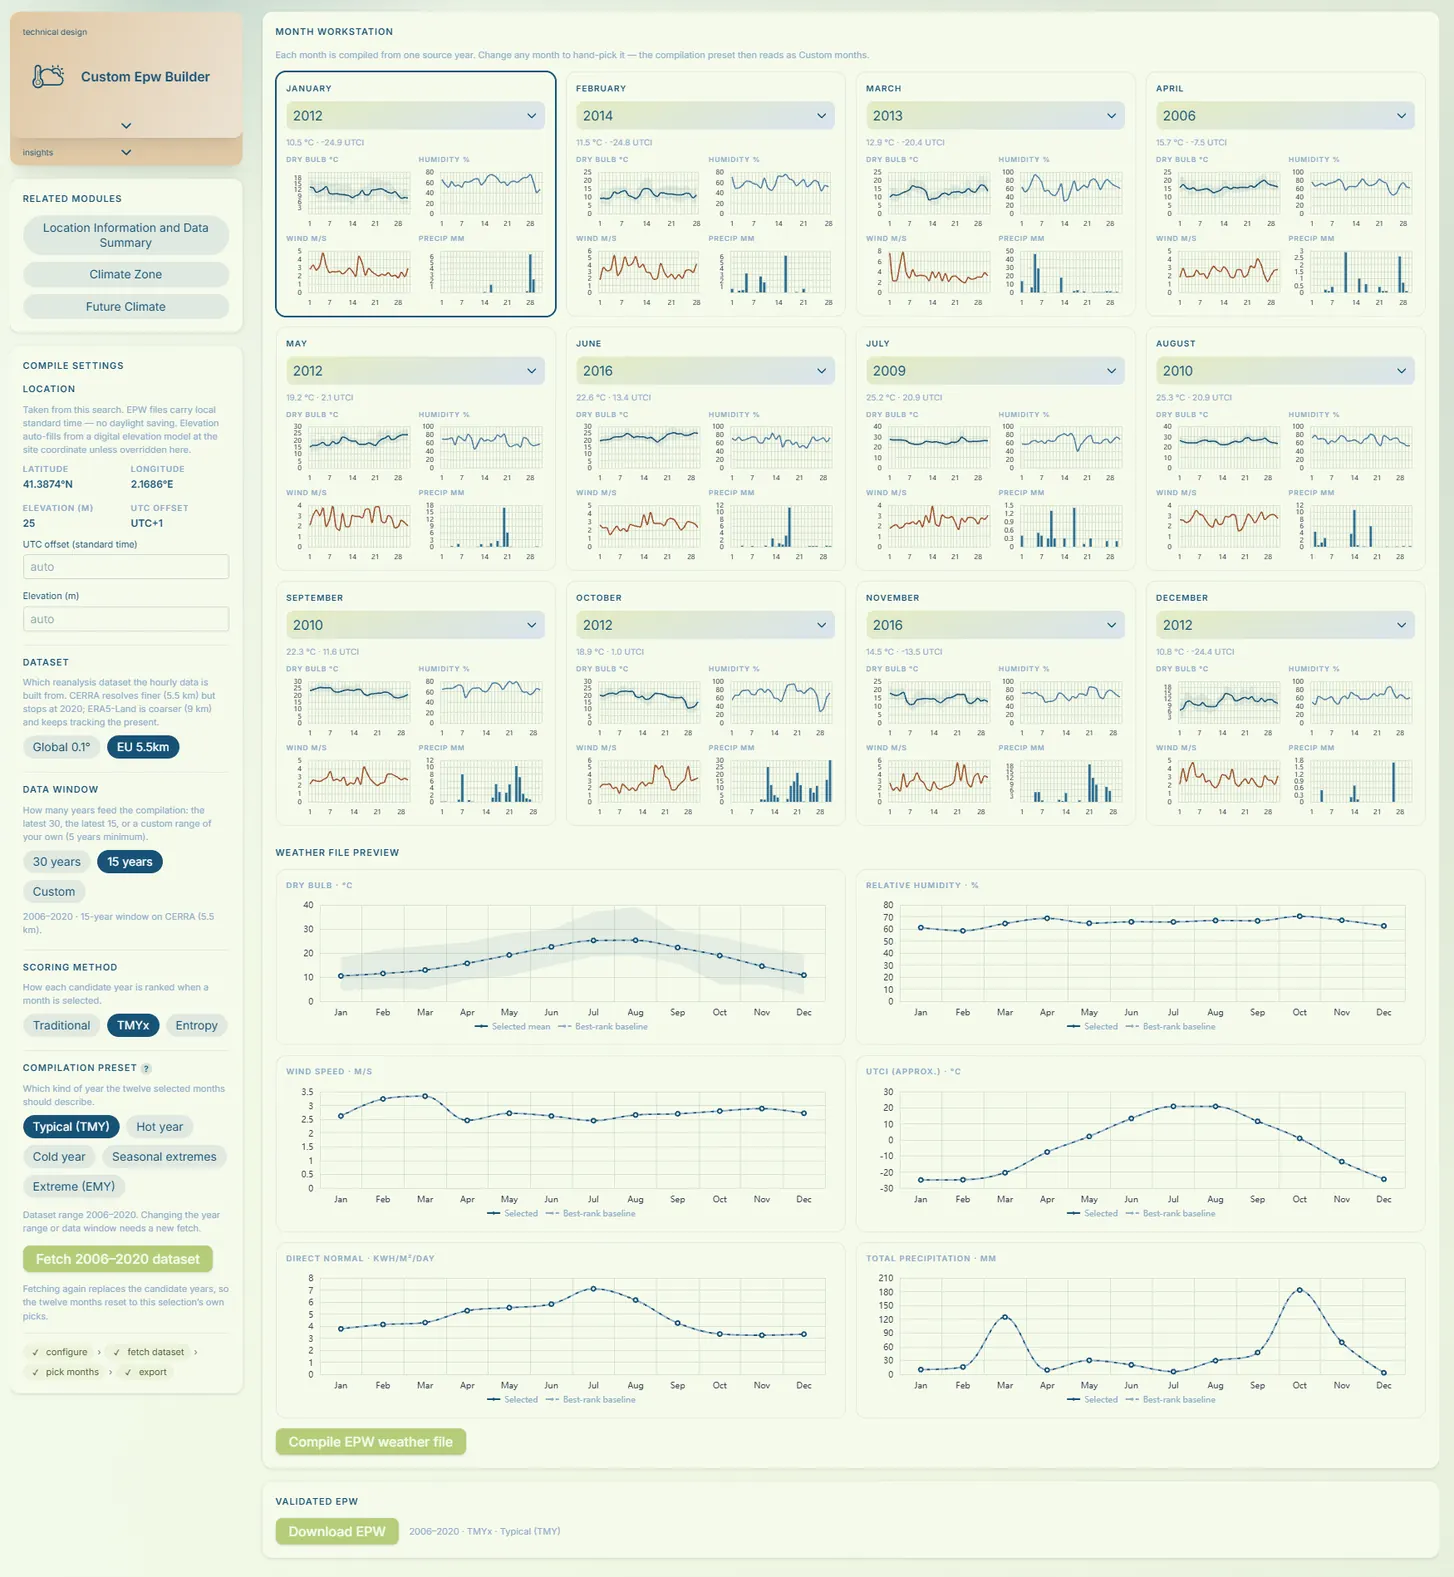
Most projects run on whatever EPW happens to exist nearby: compiled by someone else, from a period someone else chose, describing the kind of year someone else decided was typical. The Custom EPW Builder hands those decisions back to you.
dataset
Which reanalysis the hours come from.
ERA5-Land, global at 9 km and still tracking the present. Or CERRA, finer at 5.5 km across Europe, through 2020.
data window
How many years feed the compilation.
The latest 30, the latest 15, or a custom range of your own from five years up.
scoring method
How candidate years are ranked.
Traditional, TMYx or Entropy, so the method matches what the analysis is for.
compilation preset
What kind of year you want described.
Typical (TMY), hot year, cold year, seasonal extremes or extreme (EMY). Overheating is not usually tied to a typical year.
04 | intelligence
The data, read for you.
Across your project overview and inside every module, each graphic comes with a written interpretation: what it’s showing, and what it means for your site.
Every insight is generated only from your project’s own data, drawn from the results on the page, so it stays grounded in your site and nothing else.
Most interpretations are generated automatically from your project’s own results. A few are AI-assisted, where the reading genuinely benefits from it. Either way, every insight is drawn only from your project’s data, never from outside sources.
climate data
Annual Wind Rose Diagram
Wind most often blows from the northwest, covering 16% of the year’s hours. Light winds of 1.5–3.3 m/s account for 48% of hours and moderate winds of 3.3–5.5 m/s for 27%; fresh winds of 5.5–8.0 m/s reach 5%, and winds above 8.0 m/s occur in 0% of hours, so windbreaks can be lightweight.
insights
how it works
Enter a location. Get clear data.
No scripts. No weather-file wrangling. C4B automatically collects and processes site-specific climate, energy and comfort data into a report you, and the rest of your team, can actually read.
step 01
drop a pin
Type an address or click a map. We pull historical weather, regional grid intensity, and local solar & wind resource for the exact coordinates.
step 02
we compute
Sun paths, wind roses, UTCI comfort, PV potential, geothermal feasibility. A full climate & energy stack, site-specific.
step 03
you design
Receive a curated set of diagrams and design directions, ready to drop into a competition, a brief, or the first conversation with a client.
mission
From your first sketch, not your final review.
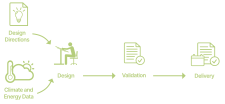
Climate and energy information is usually consulted after the design is drawn, to validate it. At C4B, we think it belongs at the start, shaping the design instead of checking it.
Not a sustainability checkbox at the end, but part of the process itself.
Common practice
with C4B
who it is for
Find your case
architects
Good architecture already understands where it stands.
Bring your site's climate into the very first sketch, not the final review. C4B turns the raw climatic conditions of any location into design direction you can act on: passive design strategies, outdoor comfort strategies, and the climate context (solar path, wind roses, UTCI comfort) that shapes a considered response from day one. Then export it as a report your team and your client can actually read.
engineers and sustainability specialists
Reliable climate and energy data from any location on the globe.
Pull a consistent, technically sound climate and energy stack for any coordinates worldwide: EPW files, psychrometric analysis, solar radiation, PV and wind potential, and grid carbon intensity. Built to sit alongside your expertise, turning hours of data-gathering into minutes, not to replace the judgment you bring to it.
developers
Climate and energy insight, ready for the decisions that come first.
Understand the site's climate and energy profile early, before the big decisions are made, in a format you can put in front of a board or a client without a technical translator. Readable reports covering local conditions, on-site energy generation potential and grid carbon intensity give you an early, defensible read on where a project stands.
universities and institutions
Teach climate-responsive design, not software
Give a whole studio the same climate baseline for any site in the world, in minutes. Students spend the semester on design decisions instead of hunting weather files and learning a simulation tool. Research teams get a consistent climate and energy stack they can apply across sites and compare.
pricing
Start free. Scale your practice.
Pricing Plans
Choose the perfect plan for your needs. Upgrade or downgrade at any time.
SAVE 16%
Free
No credit card required
Free
Free forever
Weather Station Data
Site Specific Data
Climate Data
Energy Analysis
Design Direction
Export Options
Projects / year0
Seats (plus owner)0
Advanced Analysis Tools
Custom EPW Generator
Essential
Yearly, billed monthly
€59.00/month
7-day free trial · No card required
Weather Station Data
Site Specific Data
Climate Data
Energy Analysis
Design Direction
Export Options
Projects / year10
Seats (plus owner)0
Advanced Analysis Tools
Custom EPW Generator
Teams
Yearly, billed monthly
€169.00/month
€2,028.00 yearly · billed monthly
Weather Station Data
Site Specific Data
Climate Data
Energy Analysis
Design Direction
Export Options
Projects / year25
Seats (plus owner)2
Advanced Analysis Tools
Custom EPW Generator
Technical
For specialist teams
Custom
Volume & SSO available
Weather Station Data
Site Specific Data
Climate Data
Energy Analysis
Design Direction
Export Options
Projects / yearCustom
Seats (plus owner)Custom
Advanced Analysis Tools
Custom EPW Generator
Enterprise
Tailored to your org
Custom
Volume & SSO available
Features, data scope, and user structure configured with our team to match how your organization works.
contact usFree
No credit card required
Free
Free forever
Weather Station Data
Site Specific Data
Climate Data
Energy Analysis
Design Direction
Export Options
Projects / year0
Seats (plus owner)0
Advanced Analysis Tools
Custom EPW Generator
Essential
Yearly billing
€599.00/year
7-day free trial · No card required
Weather Station Data
Site Specific Data
Climate Data
Energy Analysis
Design Direction
Export Options
Projects / year10
Seats (plus owner)0
Advanced Analysis Tools
Custom EPW Generator
Teams
Yearly billing
€1,749.00/year
€1,749.00 yearly billing
Weather Station Data
Site Specific Data
Climate Data
Energy Analysis
Design Direction
Export Options
Projects / year25
Seats (plus owner)2
Advanced Analysis Tools
Custom EPW Generator
Technical
For specialist teams
Custom
Volume & SSO available
Weather Station Data
Site Specific Data
Climate Data
Energy Analysis
Design Direction
Export Options
Projects / yearCustom
Seats (plus owner)Custom
Advanced Analysis Tools
Custom EPW Generator
Enterprise
Tailored to your org
Custom
Volume & SSO available
Features, data scope, and user structure configured with our team to match how your organization works.
contact us* Monthly plans are yearly commitments billed monthly. Cancellation takes effect after 12 billing cycles (1 year from your current billing cycle). Essential comes with a 7-day free trial. No card required. If you add a card during the trial, the plan is charged when the trial ends; otherwise your account moves to the Free plan.
Products
Purchase additional projects to expand your usage.
Projects
Add projects permanently to your organization
€350.00/per project
Number of Projects
1
Price per project€350.00
Quantity1
Total€350.00